
- The problem
- The app assumed a specialist’s vocabulary and habits, and the clinicians who most needed help didn’t have them.
- What I did
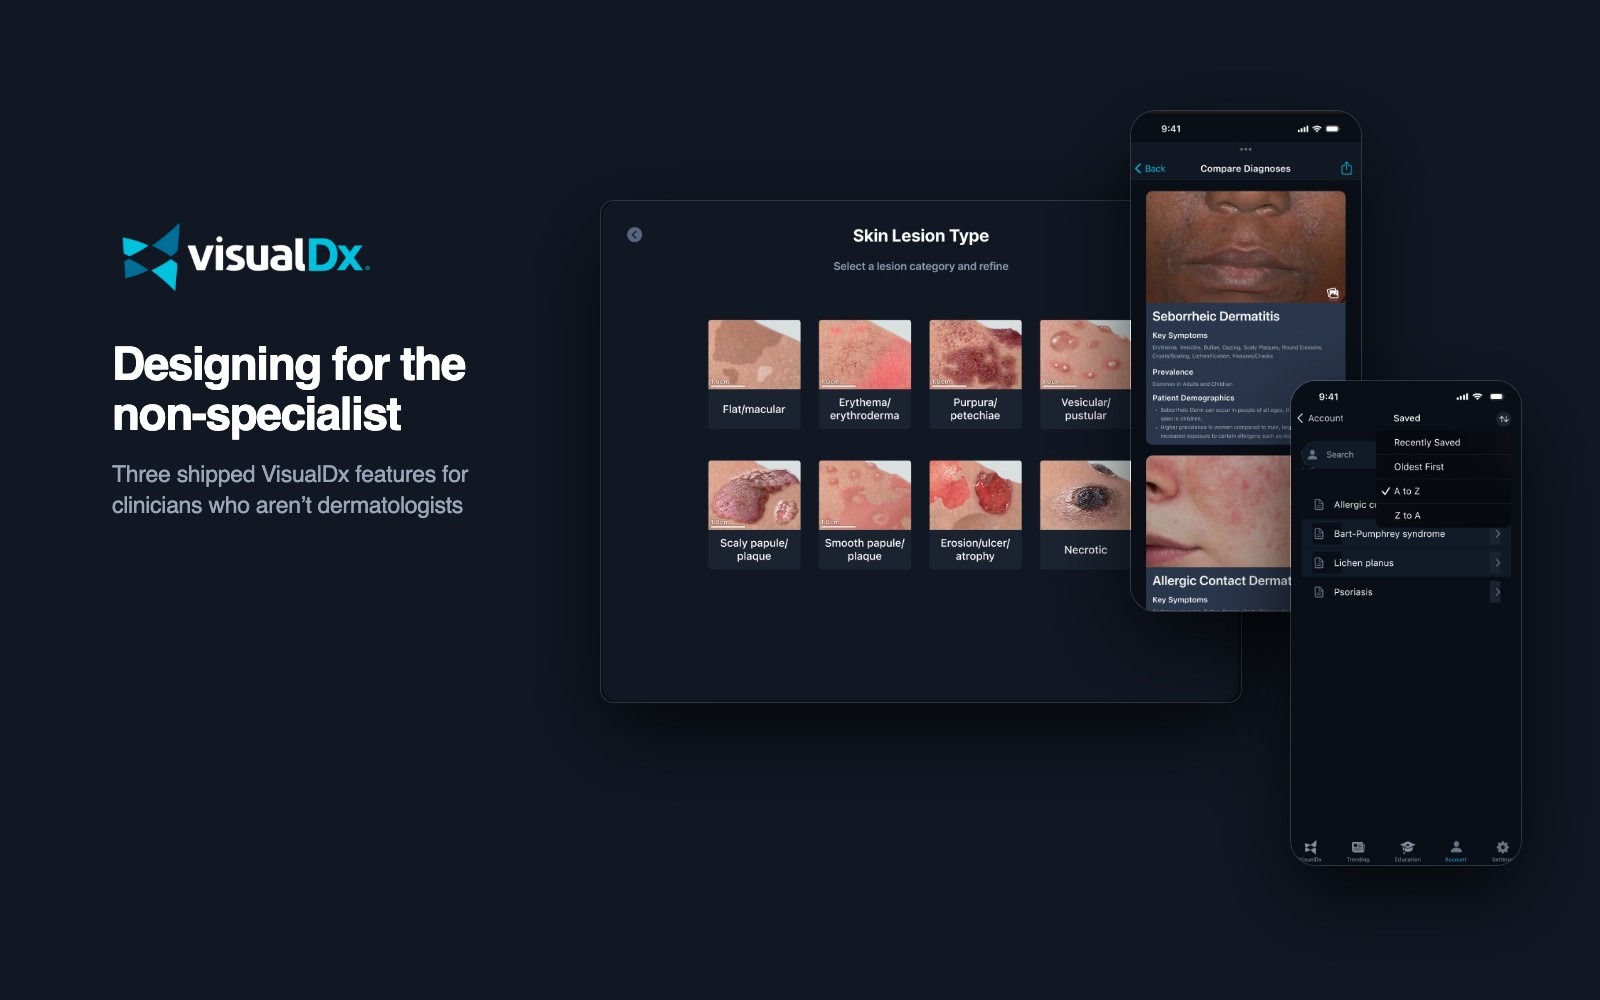
- Designed three features, each around one moment where a non-specialist got stuck, worked each through several versions, and tested two of them with 21 participants.
- Where it landed
- Lesion type examples on the web, and CompareView plus Saved Items and Recent History on mobile. All shipped.
Three moments a generalist gets stuck
- Naming what you see on the skin, in dermatology’s terms.
- Telling look-alike diagnoses apart.
- Getting back to a case you were already working on.
Who this was for
Our Principal Design Engineer described the app as a pilot’s console built for super users. The clinicians in my home screen study were the opposite: nurse practitioners and physicians who see skin problems every day without being dermatologists. They know what they’re looking at clinically. What slowed them down was the tool assuming a specialist’s words and workflow.
How VisualDx works
A clinician describes a patient in findings: a lesion type, where it is, symptoms, age and sex. VisualDx returns a ranked differential, grouped by type, such as infectious or drug-induced, with photos across skin types. Each diagnosis page then explains the condition and lists the look-alikes to rule out. Every one of those steps assumed the user already spoke dermatology.
My role and how the work moved
- Two roles. I was the Product Designer when Saved Items and Recent History began in 2023, and the Product Manager by the time lesion examples shipped in 2024. In both I owned the flows and the files.
- Scoped as tickets. Each feature lived as a numbered ticket (UD-153, UD-221, UD-227) with its own Figma file.
- Versioned in the open. Every file keeps its iterations, a discard area for directions I set aside, and dated wireframe rounds.
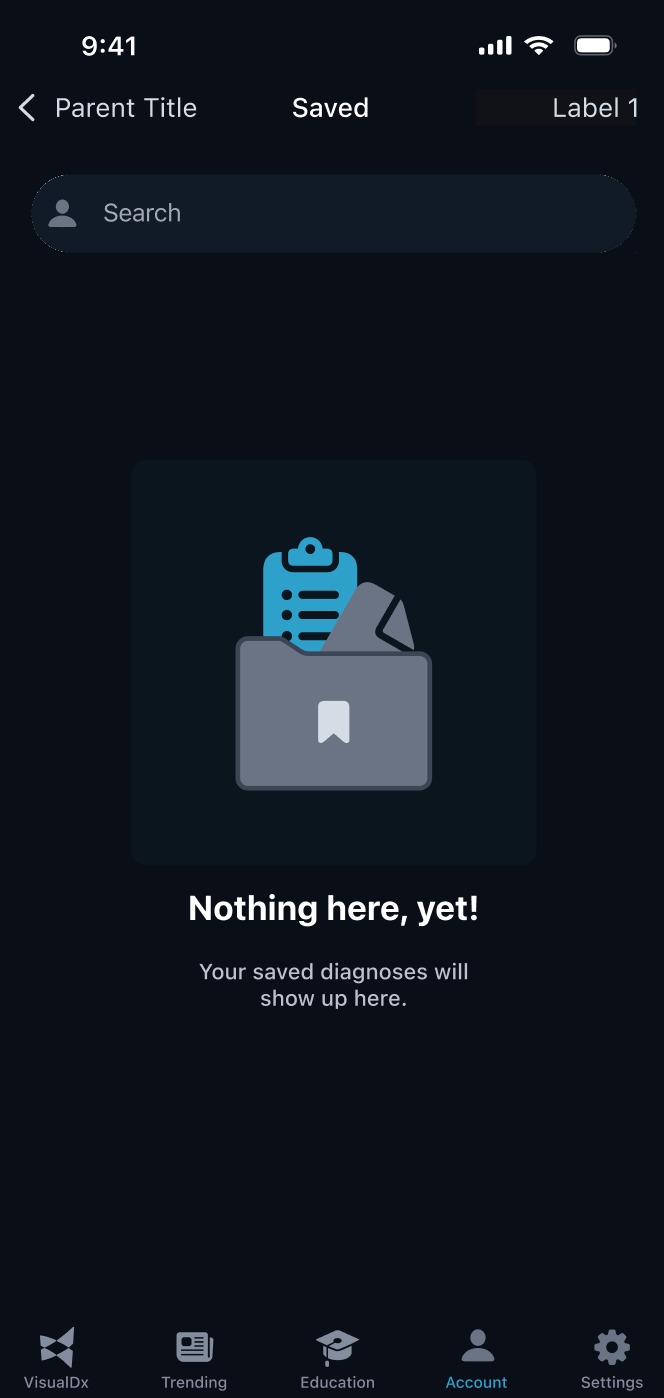
- Specs beside the screens. I wrote behavior notes under the wireframes, covering defaults, time windows, confirmations and empty states, so engineering had rules, not just pictures.
1 · Describe
Lesion type examples
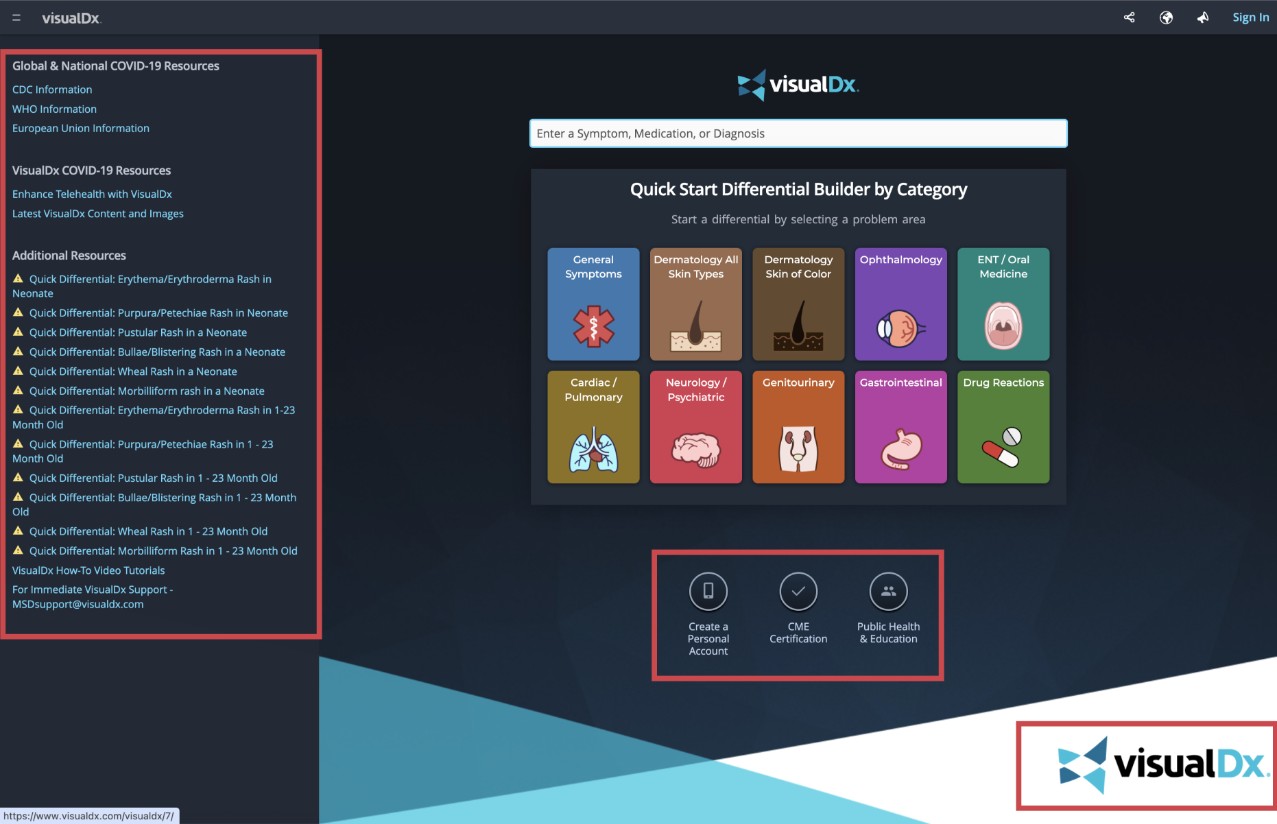
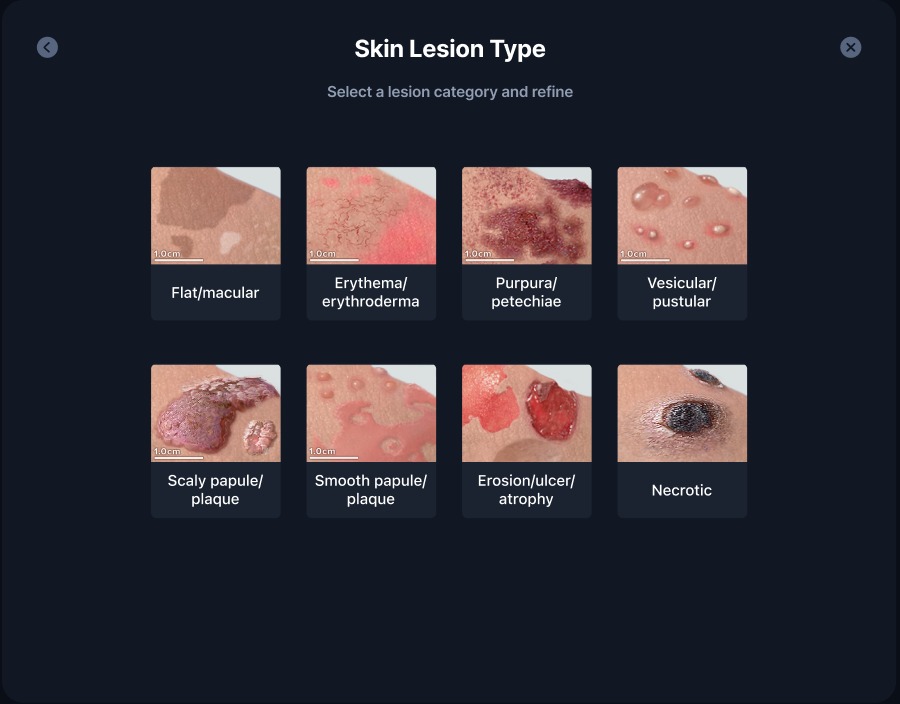
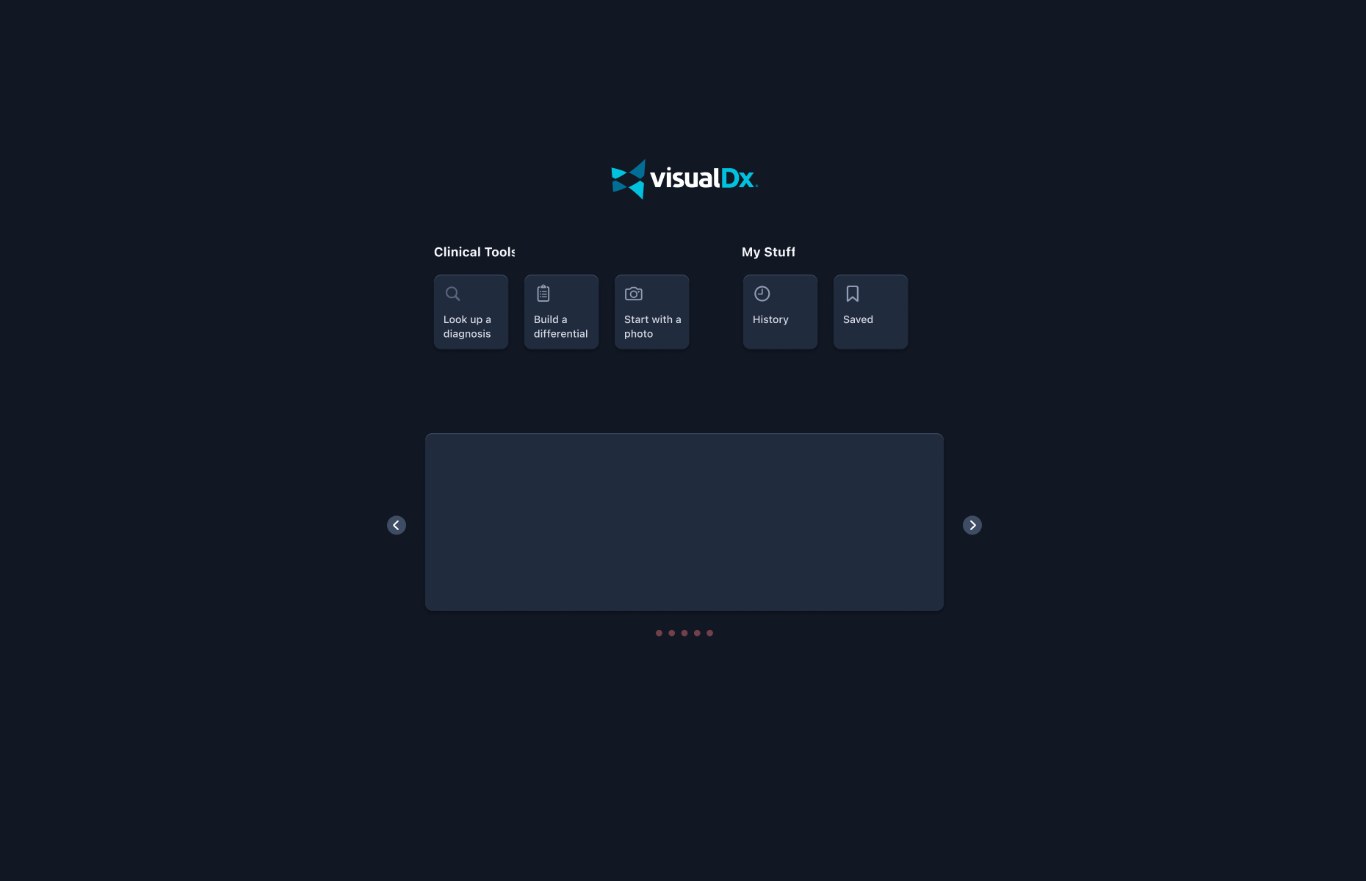
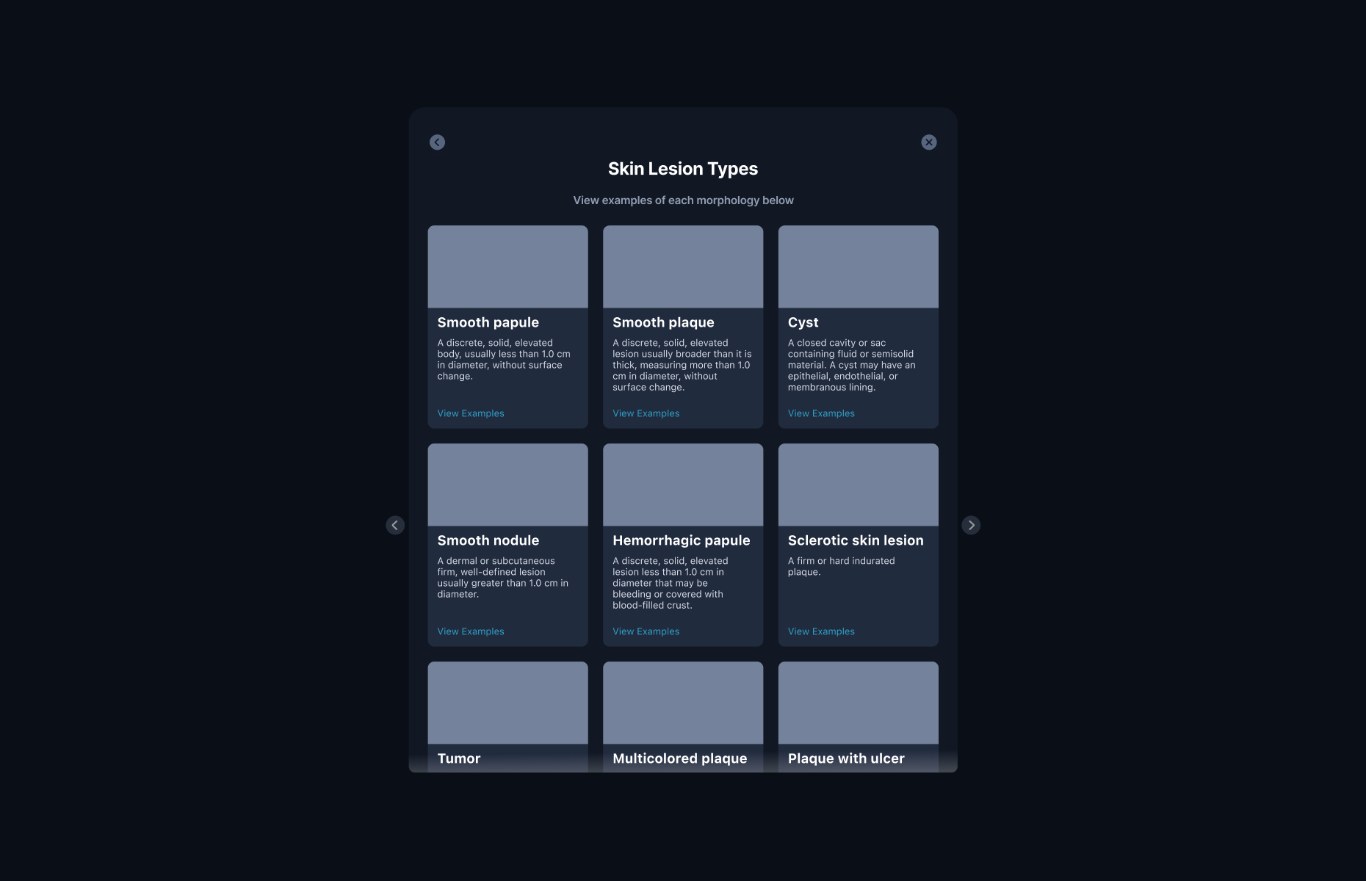
Building a differential starts with describing the skin finding: macule or papule, plaque or nodule. Dermatologists know those terms by heart; many other clinicians don’t. On the web, that step was also buried in a crowded home page.
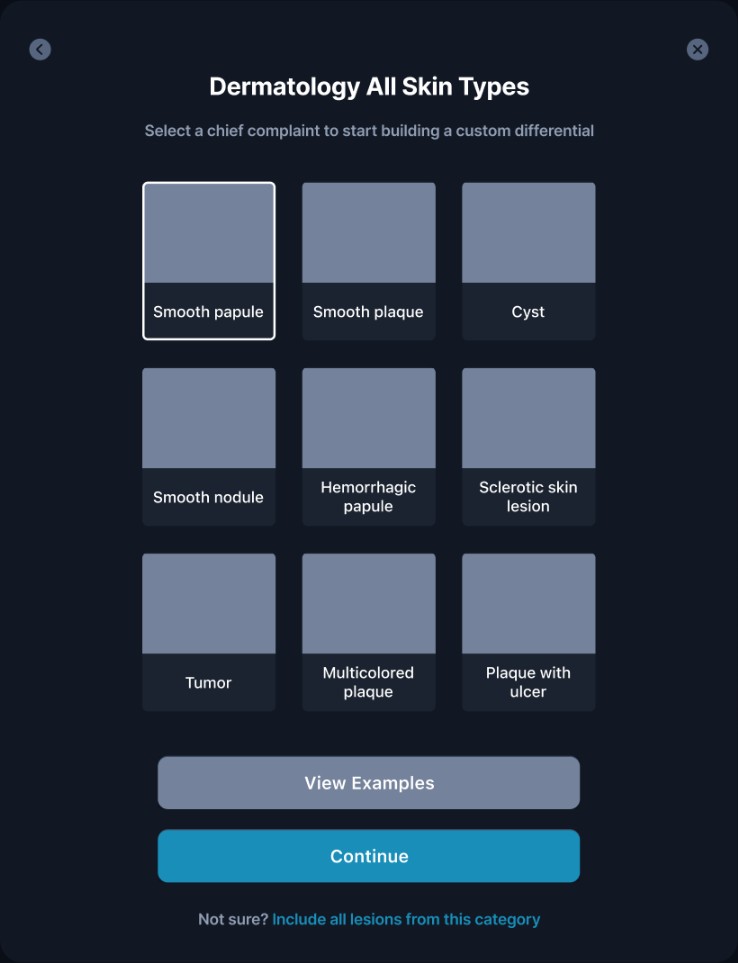
An early direction asked for the specific lesion type right away, from one grid of nine look-alike types, with a “Not sure? Include all lesions” link as the escape hatch. I set it aside. The shipped flow splits the choice in two: pick a broad category by photo first, then the specific type, with a plain definition and examples one tap away.
The decisions
What I’d measure
- Completion. How often a differential started from the web is finished, before and after.
- Backtracking. How often people go back from the specific-type step to change their category.
- Examples use. How often View Examples is opened, and whether those sessions finish.
2 · Decide
CompareView
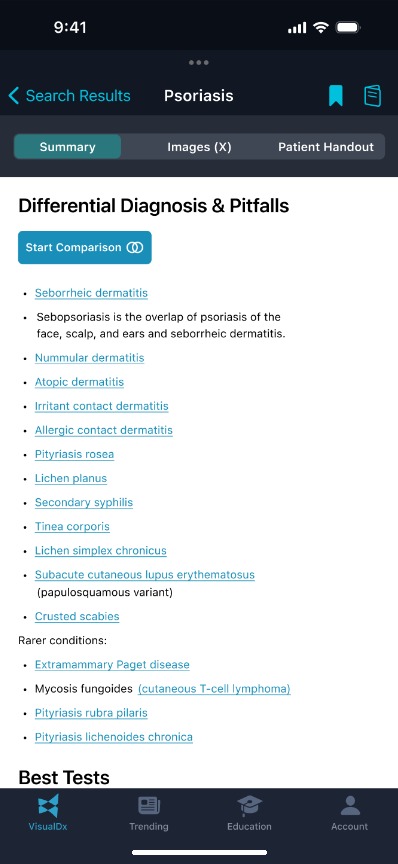
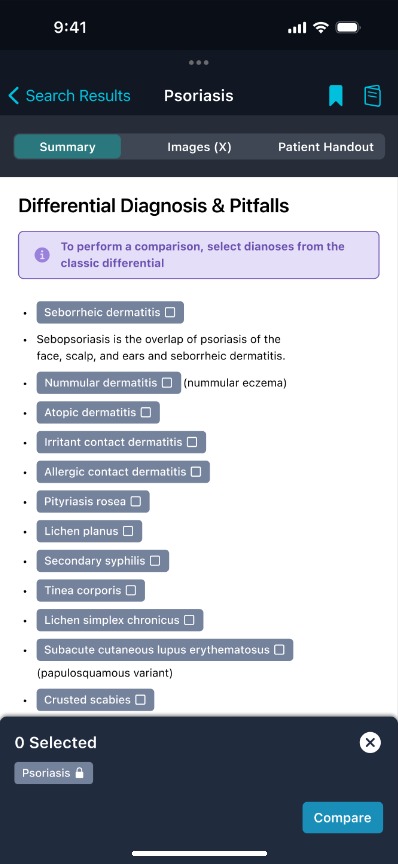
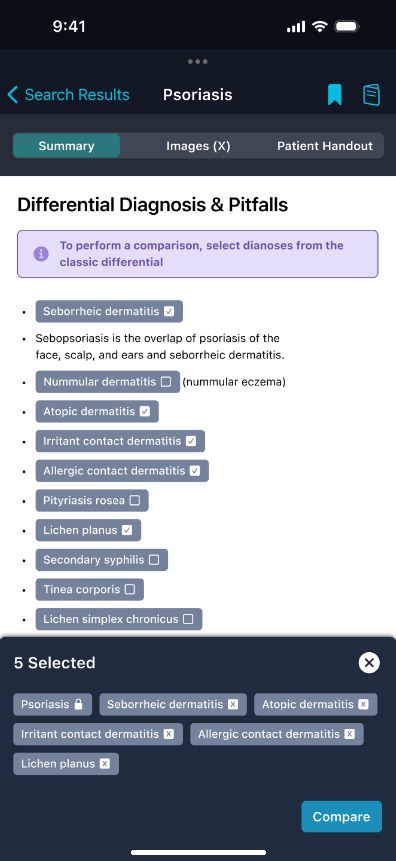
Every diagnosis page lists its differential: the conditions it’s easily confused with. In the app that list was plain links, so comparing two look-alikes meant opening one, memorizing it, going back and opening the other.
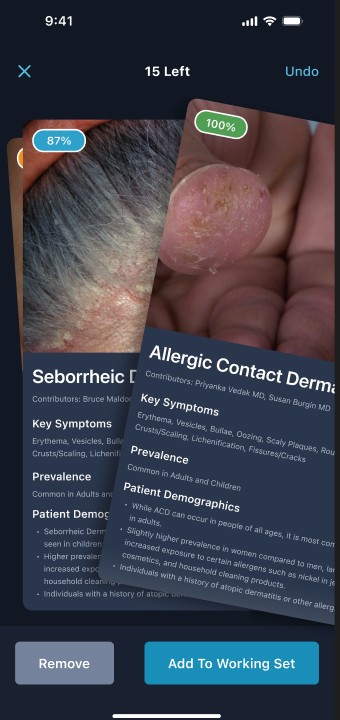
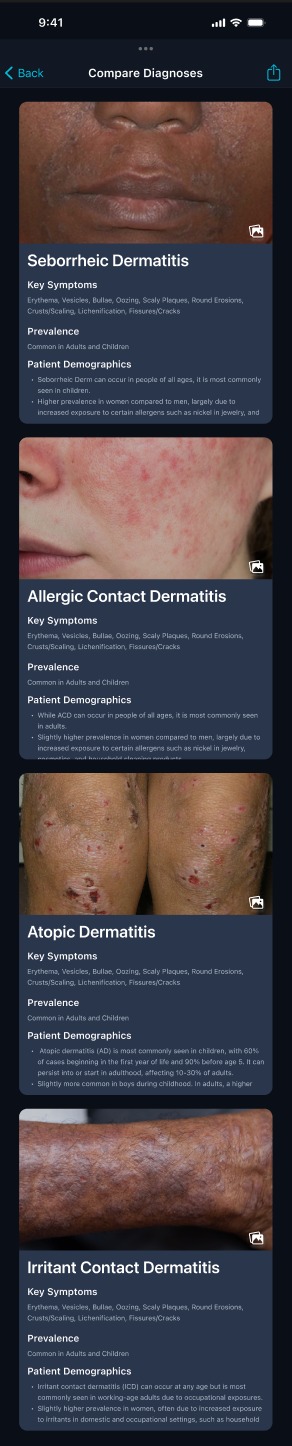
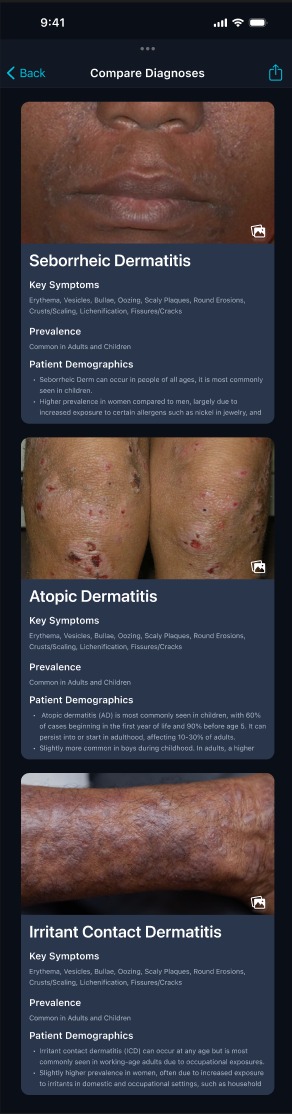
I explored a card deck you swipe through, keeping or removing each diagnosis from a working set. The shipped version kept that card anatomy (photo, key symptoms, prevalence, who it affects) but replaced swiping with selecting from the list clinicians were already reading. The current diagnosis stays locked in, so there’s always something to compare against.
The decisions
Looking back at the swipe deck
My files don’t record why the deck was set aside, so this is my read today, not the reason at the time. A deck shows one diagnosis at a time, and comparing needs two or more in view. Swiping also asks for a keep-or-remove verdict on each card, which is the judgment a generalist is opening the tool to get help with. Selecting from the list the clinician is already reading avoids both.
What I’d measure
- Use. How many diagnosis sessions start a comparison, and how many diagnoses people compare.
- Narrowing. How often people remove cards before leaving, a sign the view is helping them decide.
- Next step. Whether a comparison is followed by opening one of the diagnoses, versus abandoning.
Testing the new flows
I tested the redesigned lesion and compare flows in an unmoderated Hubble study, setting the new designs against the flows they replaced.
Both then shipped. The measures above are what I’d use to check that the preference holds up in daily use.
3 · Return
Saved Items and Recent History
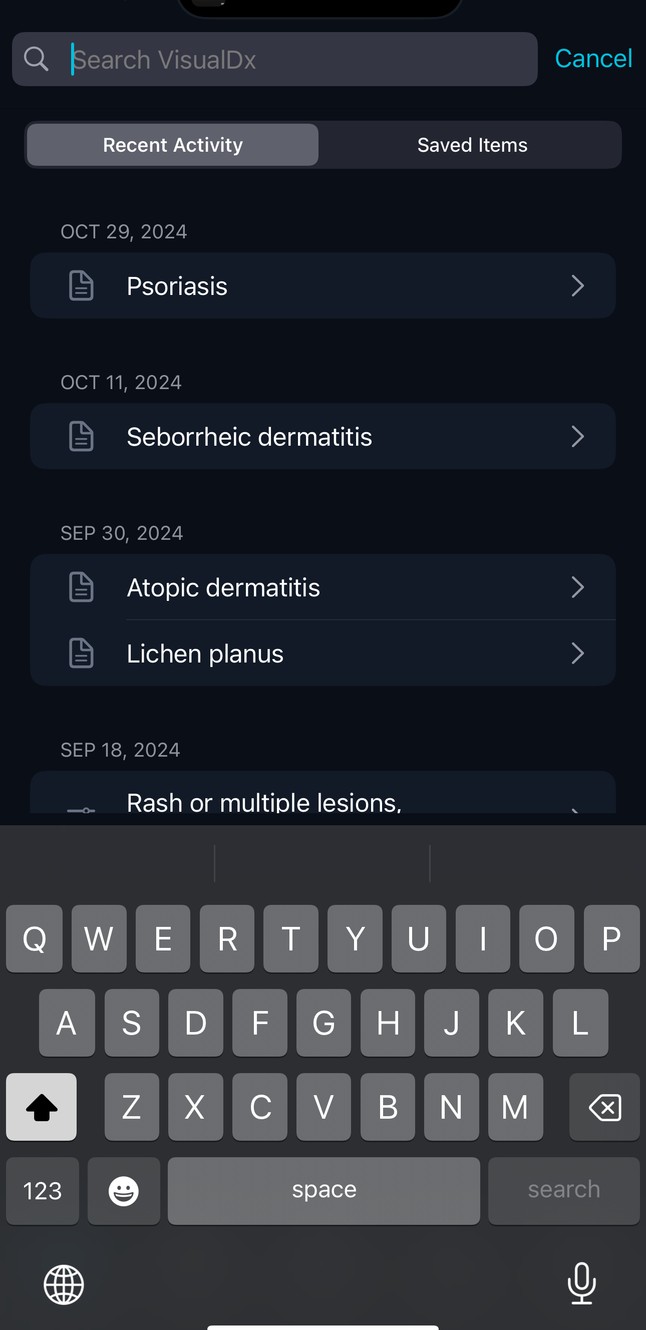
Clinicians come back to the same diagnoses, often mid-case. I designed where that history lives and wrote the rules for how it behaves alongside the screens:
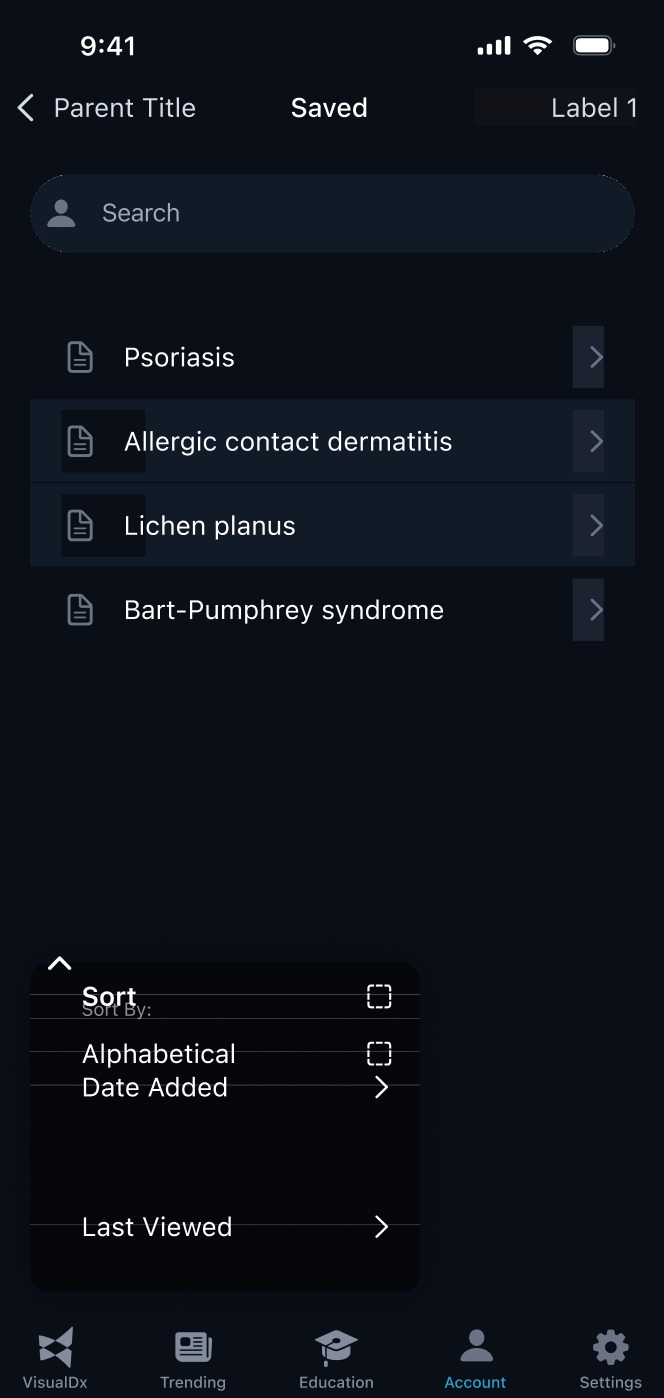
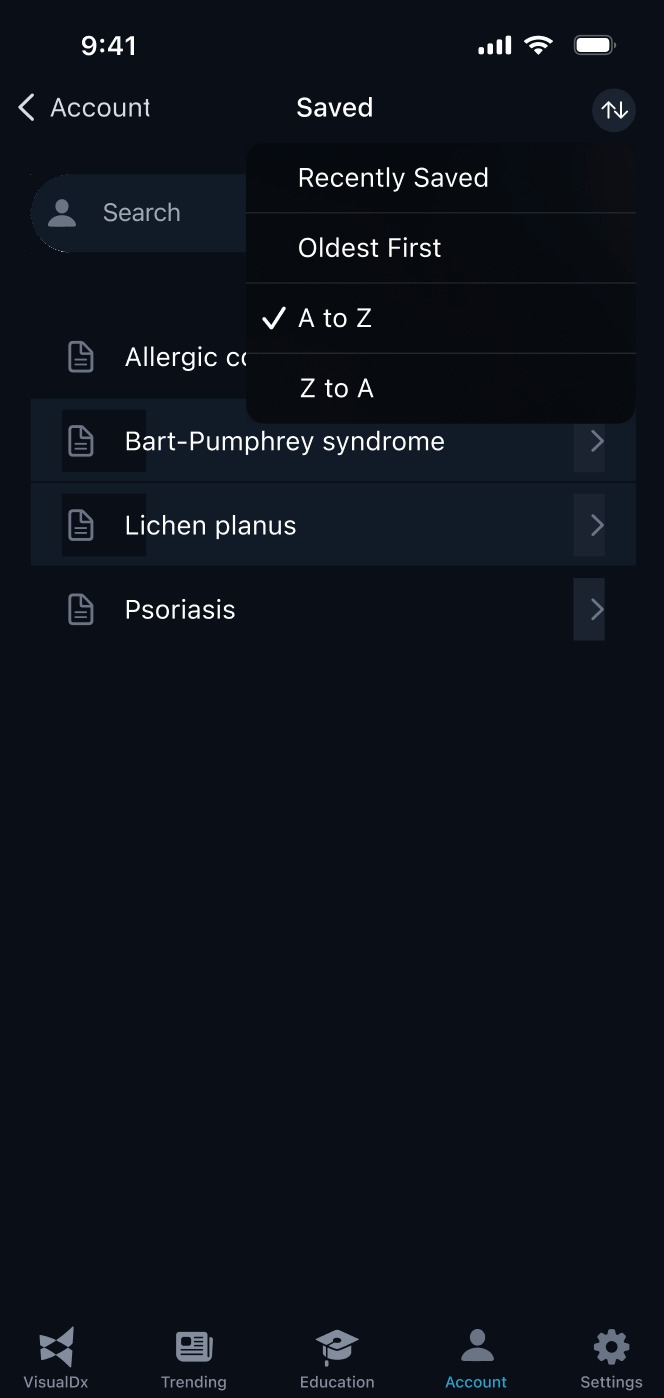
Sorting is where my notes record a real decision. The first version used checkboxes, which implied you could sort alphabetically and by date at the same time. I wrote:
“I felt it was best to utilize dropdown menus in order to mitigate toggle confusion.”
My design notes, October 2023
The final version went one step further: a single-choice menu of Recently Saved, Oldest First, A to Z and Z to A, where only one option can ever be on.


What I’d measure
- Return speed. Time from opening search to reopening a diagnosis viewed before.
- Saving. How many active users save at least one diagnosis, and how often they open Saved.
- Clutter. How often items are deleted, a sign the list stays useful rather than piling up.
Principles that carried across
What I learned
In a tool built by experts, the expertise can become the barrier. Each of these features moved one specialist assumption out of the way: the vocabulary, the memory needed to compare, and the effort of finding your place again. None of them hid the precise terms dermatology depends on. They just stopped requiring you to know them before you could start.
A note on sources: this case study is rebuilt from my original Figma files, including my design notes, iterations and discarded directions. Where the files don’t record a reason, I say so instead of filling one in.